NYC Election Atlas

![]()
![]()
The Missing Million: The Unregistered Eligible Voter Population in New York City
The Center for Urban Research at the CUNY Graduate Center analyzed the latest voter registration data for New York City and population/demographic estimates from the Census Bureau's American Community Survey to identify and describe the city's eligible but unregistered voter population.
You can download/view the report here.
View John Mollenkopf's presentation slides from the May 16, 2025 Democracy in New York: Defending and Securing Voting Rights forum. The slides highlight key findings from the Missing Million analysis.
The Democracy in New York forum is sponsored by New Yorkers for Inclusive Democracy in partnership with City & State.
Citywide Ranked Choice Voting vote allocations for Mayor (2025 primary)
Certified results available here from NYC Board of Elections
Citywide Ranked Choice Voting vote allocations for Mayor (2021 primary)
Certified results available here from NYC Board of Elections
Citywide Ranked Choice Voting vote allocations for Comptroller (2021 primary)
Certified results available here from NYC Board of Elections
How we created the demographic data tables [HISTORICAL DATA — CURRENT THROUGH 2012]
Please contact the CUNY Mapping Service for access to this earlier data.
The NYC Election Atlas provides tables of demographic information for selected ethnic groups on a citywide basis. The Atlas also provides community area information for local populations (presenting the distribution of selected groups within each area, but summarizing the demographic characteristics of the area population regardless of ethnicity). We describe below how we selected and defined the ethnicities, and how and why the data is presented at the citywide and local levels.
The Atlas has been developed in partnership with the CUNY Graduate School of Journalism and its Center for Community and Ethnic Media (CCEM). The Center in particular is interested in journalism addressing the interests of neighborhoods and immigrant ethnic groups. Therefore, the ethnicities represented in the Atlas's citywide demographic tables include those of greatest interest to the media organizations represented by CCEM.
In particular, we focused on three broad groupings:
- native born, non-Hispanic Whites who are not recent immigrants but have lived in the city for some time;
- native born, non-Hispanic Blacks or African Americans whose ancestors have a relatively long history in this country including many who migrated to New York from the American South; and
- recent immigrant groups from Latin America and Asia.
Within each of these broad groupings we have used Census data to identify specific ethnicities in order to cross-tabulate with other Census data of interest to the Journalism School, CCEM, and the public.
Citywide vs. local area dataWe present the data by selected ethnicities on a citywide basis, and we present demographic characteristics of the overall population of each community area (as defined by the U.S. Census Bureau - more on PUMAs below). Citywide and community area statistics are based on the Center for Urban Research's (CUR) analysis of American Community Survey (ACS) data. The Census Bureau launched the ACS in 2005 as a substitute for the previous "long form" data that had provided detailed demographic data of interest to many.
The ACS data comes in two forms — summary tables created by the Census for block groups, tracts, and larger geographies; and "microdata" data on individuals and households, made anonymous, with the "Public Use Microdata Area" (PUMA) as the smallest unit of geography. The summary ACS tables are pre-tabulated, making them easy to use for basic demographic data but impossible to use for any new or customized cross-tabulations of the kind needed for the Election Atlas. The Public Use Microdata Sample (PUMS) data enable us to cross-tabulate the data however we need to, but only for areas no smaller than a PUMA.
The Center for Urban Research used the combined 3-year ACS PUMS data covering the period 2009 through 2011 to have sufficient sample sizes to analyze demographic characteristics of our selected groups citywide. (We used the ACS data as maintained by the Integrated Public Use Microdata Series/IPUMS project of the Minnesota Data Center at the University of Minnesota.) We also used the PUMS data to determine the total population distribution of these groups for each PUMA. But even with the combined 2009-11 ACS data, PUMS samples are still generally too small to provide statistically valid estimates for our cross-tabulations of demographics for each group at the PUMA level. That is why we present the PUMA-level data for the overall local population rather than specific ethnicities.
PUMA boundaries include whole census tracts and were designed in cooperation with the New York City Department of City Planning to resemble Community Boards, but also contain at least 100,000 people. Thus there are 59 Community Boards in New York City, but 55 PUMAs. This map [PDF] compares the PUMA and Community Board boundaries.
Ethnic group definitionsOur groups are defined as described below, based on how people filled out their American Community Survey questionnaires. We use answers to the questions about specific racial groups, ancestry, and place of birth. For ancestry, we use only the reported "first ancestry" even though some people report multiple ancestries. These definitions allow us to use Census data to develop detailed profiles of the many groups in New York City, including how many of the group are voting age citizens, thus eligible to vote, and what share of the overall eligible electorate each group contributes.
- Italian ancestry
- Non-Hispanic native born whites who reported their ancestry as Italian or Sicilian.
- Irish ancestry
- Non-Hispanic native born whites of Irish ancestry.
- Jewish heritage
- Non-Hispanic native born whites with reported ancestries from the Eastern European countries from which Jews migrated a century ago (e.g. Russia, Poland, Romania, Hungary, Czechoslovakia) but not Polish-speaking (to select out those of Polish Catholic ancestry) or those born in the former Soviet Union. Because the Census Bureau does not ask questions regarding a respondent's religious affiliation, we defined Jews as persons who trace their ancestry to those countries that the early waves of Jewish immigrants came from including Hungry, Poland, Russia, Eastern Europe and Romania. This is not a perfect operational definition of being Jewish, but it is the best that can be done using Census Bureau American Community Survey data.
- German ancestry
- Non-Hispanic native born whites of German ancestry.
- British, Scottish and Welsh ancestry
- Non-Hispanic native born whites of English, British, Scottish, Scottish-Irish, or Welsh ancestry.
- Russian foreign born
- Non-Hispanic whites born in the republics of the former Soviet Union (Russia, Ukraine, Uzbekistan, Kazakhstan).
- African American
- Native born people who reported their race as non-Hispanic Black/African American and reported their ancestry as Afro American, African American, or African ancestry.
- Afro Caribbean
- People, regardless of place of birth, who reported their race as Black and reported their ancestry as the English-speaking islands of the Caribbean as well as Guyana, but excluding those who said their ancestry or place of birth was Haiti.
- Haitian
- People who reported their ancestry or place of birth was Haiti.
- Subsaharan Africa
- Foreign born Blacks who reported ancestry from any of the sub-Saharan countries in Africa (from Senegal east to Ethiopia and south to South Africa).
- Mexican
- People reporting Mexican as their Hispanic ethnicity, regardless of race.
- Puerto Rican
- People reporting Puerto Rican as their Hispanic ethnicity.
- Ecuadorian
- People reporting Ecuadorian as their Hispanic ethnicity.
- Dominican
- People reporting Dominican as their Hispanic ethnicity.
- Brazilian
- People reporting Brazil as their ancestry or place of birth.
- Chinese
- People reporting Chinese as their specific Asian race.
- Indian
- People reporting Asian Indian as their specific Asian race.
- Korean
- People reporting Korean as their specific Asian Race.
- Bangladeshi
- People reporting Bangladesh as their specific Asian Race.
- Pakistani
- People reporting Pakistan as their specific Asian Race.
- Other White (non-Hispanic)
- All other single-race combinations reported as non-Hispanic White.
- Other Black (non-Hispanic)
- All other single-race combinations reported as non-Hispanic Black.
- Other Latino/Hispanic
- All other single-race combinations who reported Hispanic ethnicity.
- Other Asian (non-Hispanic)
- All other single-race combinations reported as non-Hispanic Asian.
- All other (Native American, 2+ races, etc)
- All other non-Hispanic races and multi-racial population.
The data below do not yet reflect the 2013 results. An updated voter registration file from the Board of Elections will not be available at least until late 2013 or early 2014.
The voter files from the NYC Board of Elections do not provide a voter's race or ethnicity. But by examining the last names of individual voters, race or ethnicity can be inferred by comparing with a distinctive surname dictionary. (For example, surnames from Census Bureau data have been used to analyze demographic characteristics [PDF] of the general population.) CUR director John Mollenkopf has developed a surname database for several ethnicities from NYC's voter registration files. Based on this local distinctive surname analysis, CUR has estimated the number of voters for recent elections for the race/ethnicity categories shown below.
There are limitations to this approach. For one, surname analysis is not possible for all 25 of the ethnicities analyzed for this Election Atlas. Also, the data are estimates, since some surnames can be ambiguous and therefore may be assigned a probability of belonging to one group or another. Finally, voting estimates for blacks shown below are not based on surname analysis; they are based on the proportion of each tract's non-Hispanic black population who are citizens of voting age, applied to the number of voters in each tract and then summed citywide.
The Board of Elections voter file does not distinguish if a person has voted in a specific general, primary, or runoff election, only that they voted in one or more of those elections in a given year.
In the table and chart below, the surname estimates account for more than 60% of each category (registered voters, or actual voters in a given election).
| Citywide | Jewish | Russian | Italian | Irish | Black | Hispanic | Chinese | Korean | |
| Primary voting in 2009 | |||||||||
| 2009 registered Democrats | 2,842,291 | 200,788 | 27,274 | 59,757 | 77,784 | 806,930 | 547,155 | 69,998 | 27,957 |
| Voting in any 2009 Democratic primary | 392,452 | 41,860 | 3,197 | 6,734 | 12,845 | 112,157 | 56,203 | 13,502 | 5,864 |
| Average 2009 Democratic primary turnout | 13.8% | 20.8% | 11.7% | 11.3% | 16.5% | 13.9% | 10.3% | 19.3% | 21.0% |
| Runoff voting in 2009 | |||||||||
| Voting in any 2009 Democratic runoff | 237,875 | 29,080 | 3,197 | 3,526 | 8,050 | 60,070 | 22,428 | 14,940 | 4,207 |
| Average 2009 Democratic runoff turnout | 8.4% | 14.5% | 11.7% | 5.9% | 10.3% | 7.4% | 4.1% | 21.3% | 15.0% |
| General election voting in 2009 | |||||||||
| 2009 registered voters (all parties) | 4,121,221 | 284,077 | 54,813 | 104,166 | 122,863 | 999,958 | 721,042 | 136,195 | 48,700 |
| Voting in any 2009 general election | 1,118,830 | 106,251 | 18,922 | 29,078 | 40,052 | 277,439 | 144,416 | 36,178 | 13,859 |
| Average 2009 general election turnout | 27.1% | 37.4% | 34.5% | 27.9% | 32.6% | 27.7% | 20.0% | 26.6% | 28.5% |
| General election voting in 2012 | |||||||||
| 2012 registered voters (all parties) | 4,266,715 | 287,299 | 56,881 | 102,682 | 122,942 | 1,159,123 | 735,703 | 150,572 | 50,746 |
| Voting in any 2012 general election | 2,396,242 | 171,506 | 26,869 | 55,510 | 74,417 | 671,159 | 369,519 | 59,344 | 23,369 |
| Avg 2012 general election turnout | 56.2% | 59.7% | 47.2% | 54.1% | 60.5% | 57.9% | 50.2% | 39.4% | 46.1% |
Turnout trends in NYC Democratic primaries
The chart and tables below provide an overview of voter turnout in Democratic primary elections in New York City from 2001 through 2020. In addition to showing overall voter turnout in each election, we have aggregated voting results by Census tracts, and have presented the number of votes within tracts based on predominant race/Hispanic origin characteristics.
The race/Hispanic origin categories are as follows, based on self-reported responses to the Census Bureau's American Community Survey:
- NHW = non-Hispanic White population;
- NHB = non-Hispanic Black population;
- NHA = non-Hispanic Asian population; and
- H = Hispanic population (per self-reporting to Census Bureau surveys, Hispanic persons can be any race).
Using the Census Bureau's special tabulation of the demographic composition of each tract's citizen voting age population (or CVAP, the estimated number of citizens age 18 or older), we have identified tracts with a CVAP majority or plurality of each race/Hispanic origin group listed above, and summed the number of votes in those tracts for each election. This is based on American Community Survey 2015-2019 tract estimates. The vote data is from the NYC Board of Elections, combining the voter registration list provided to the Center for Urban Research after each election, with voter history data to indicate which voters voted in each election.
Please remember two important points about this data:
- Election totals do not equal published totals because not all voters could be geocoded to census tracts; and
-
The numbers do not necessarily reflect the race or Hispanic origin characteristics of voters themselves. Instead, the chart and tables present the number of voters in neighborhoods whose population is predominantly one group or another. This information can be used to say, for example, that:
- "45% of the votes in the 2020 presidential primary were from neighborhoods whose eligible voting population is predominantly White and not of Hispanic origin," or
- "5.4% of the votes in the 2020 presidential primary were from neighborhoods whose eligible voters are predominantly Asian and not of Hispanic origin."
The data was compiled by John Mollenkopf, Center for Urban Research, The Graduate Center, CUNY May 2021. Please use this citation and a link to this webpage when referencing this data.
FIGURE 1: Turnout by predominant race/ethnicity
TABLE 1: Number of voters in tracts by predominant race/ethnicity
| 2001 Democratic Mayoral Primary | 2001 Mayoral Runoff | 2005 Democratic Mayoral Primary | 2009 Democratic Mayoral Primary | 2013 Democratic Mayoral Primary | 2017 Democratic Mayoral Primary | 2018 Democratic Gubernatorial primary | 2008 Democratic Presidential Primary | 2016 Democratic Presidential Primary | 2020 Democratic Presidential Primary | |
| Total votes | 780,485 | 785,483 | 477,820 | 328,434 | 691,211 | 475,518 | 905,643 | 844,777 | 959,304 | 833,449 |
| Votes from predominantly NHW tracts | 340,078 | 345,216 | 214,003 | 149,135 | 317,890 | 204,647 | 404,872 | 362,105 | 424,492 | 375,188 |
| Votes from predominantly NHB tracts | 211,981 | 208,714 | 122,643 | 95,269 | 200,516 | 140,140 | 267,427 | 242,686 | 276,791 | 241,134 |
| Votes from predominantly Hispanic tracts | 183,782 | 188,381 | 117,686 | 63,609 | 133,274 | 100,691 | 186,801 | 190,656 | 206,425 | 172,089 |
| Votes from predominantly NHA tracts | 44,617 | 43,145 | 23,388 | 20,362 | 39,331 | 30,030 | 46,523 | 49,149 | 51,596 | 44,869 |
TABLE 2: Percent of voters in tracts by predominant race/ethnicity
| 2001 Democratic Mayoral Primary | 2001 Mayoral Runoff | 2005 Democratic Mayoral Primary | 2009 Democratic Mayoral Primary | 2013 Democratic Mayoral Primary | 2017 Democratic Mayoral Primary | 2018 Democratic Gubernatorial primary | 2008 Democratic Presidential Primary | 2016 Democratic Presidential Primary | 2020 Democratic Presidential Primary | |
| Votes from predominantly NHW tracts | 43.6% | 43.9% | 44.8% | 45.4% | 46% | 43% | 44.7% | 42.9% | 44.2% | 45% |
| Votes from predominantly NHB tracts | 27.2% | 26.6% | 25.7% | 29% | 29% | 29.5% | 29.5% | 28.7% | 28.9% | 28.9% |
| Votes from predominantly Hispanic tracts | 23.5% | 24% | 24.6% | 19.4% | 19.3% | 21.2% | 20.6% | 22.6% | 21.5% | 20.6% |
| Votes from predominantly NHA tracts | 5.7% | 5.5% | 4.9% | 6.2% | 5.7% | 6.3% | 5.1% | 5.8% | 5.4% | 5.4% |
Analysis of 2013 mayoral primary
Bill de Blasio won the Democratic mayoral primary with almost 41% of the vote. Given that he received substantial support both from black and white neighborhoods, as well as from Latino areas, some observers have described his victory as a waning of traditional identity politics based on race/ethnicity relationships.
His victory was impressive in several ways. But the preliminary results reveal electoral patterns that require more nuanced interpretation than most observers have provided, and contain important similarities with earlier primary elections. This analysis examines several of these similarities and differences. Most primary voters also vote in the general election, so an examination of the primary vote patterns can provide insights into one segment of the general electorate.
Turnout by predominant ethnicity
Table 1 below shows turnout in the Democratic mayoral primary in areas of the city broken down by the predominant race/ethnicity/ancestry of each Census tract. For each type of area, the table shows votes in the 2013 primary, registered Democrats in 2012, and ratio between the two (turnout).
The Center for Urban Research developed these population breakdowns first in terms of which racial group is the majority or plurality, then which ancestries or language groups are the plurality or majority within that dominant group (the groupings are a consolidated version of the list here, described here). While the Census does not record religion, we know that different religious affiliations are predominant among people of specific ancestries and language groups. The category of whites with English or Scandinavian ancestries, for example, tend to be Protestant, while those who are of Irish or Italian ancestry or who speak Polish, tend to be Catholic. (Many Jewish New Yorkers have Polish ancestry, but they do not speak Polish.)
Overall, Table 1 shows that predominantly white areas had the largest turnout in the primary, followed by predominantly African American/Afro Caribbean areas and then Latino communities. (Predominantly Chinese areas turned out at a level just below the black areas.) And in terms of total votes, predominantly white areas contributed 1.5 times the number of votes than predominantly black areas, more than twice the Hispanic/Latino areas, and far more than other communities.
| TABLE 1 | ||||||||
| Turnout by race/ethnicity/ancestry categories based on CUR analysis of Census data |
2013 primary vote |
2012 registered Democrats |
Turnout percent |
|||||
| White (English, Scandinavian) | 5,276 | 18,521 | 28.5% | |||||
| White (Italian, Irish, and Polish speakers) | 185,624 | 747,616 | 24.8% | |||||
| White (Russian, Ukranian; Polish ancestry) | 94,147 | 326,877 | 28.8% | |||||
| Black (African American) | 148,881 | 687,246 | 21.7% | |||||
| Black (Afro Caribbean) | 32,602 | 151,086 | 21.6% | |||||
| Hispanic (Puerto Rican) | 58,556 | 335,048 | 17.5% | |||||
| Hispanic (Dominican) | 45,229 | 244,779 | 18.5% | |||||
| Hispanic (other Latino immigrant groups) | 38,838 | 223,539 | 17.4% | |||||
| Asian (Chinese) | 20,801 | 102,728 | 20.2% | |||||
| Asian (South Asian) | 8,162 | 50,955 | 16.0% | |||||
| Other Asian | 4,339 | 21,962 | 19.8% | |||||
| Other | 99 | 470 | 21.0% | |||||
| Total | 645,902 | 2,910,827 | 22.1% | |||||
| Totals may be slightly different than Board of Election results due to the process of allocating Election District data to blocks and tracts. | ||||||||
Vote share trends by ethnicity in the last four mayoral primaries
Table 2 shows that past elections had a similar distribution of vote share by area. Close to half (44%) of the 2013 primary vote came from predominantly white areas, a consistent share since 2001. But Table 2 also shows that votes from predominantly African American communities are substantial — 20 to 24% since 2001. Less than a third of the votes in each of the last four primaries came from areas of newer immigrant groups from Latin America, Asia, or the Caribbean.
| TABLE 2 | |||||||||||
| Vote share by race/ethnicity/ancestry categories based on CUR analysis of Census data |
2013 vote | 2013 percents | 2009 vote | 2009 percents | 2005 vote | 2005 percents | 2001 vote | 2001 percents | |||
| White (English, Scandinavian) | 5,276 | 0.8% | 3,104 | 0.9% | 4,180 | 0.9% | 5,594 | 0.7% | |||
| White (Italian, Irish, and Polish speakers) | 185,624 | 28.7% | 96,125 | 29.3% | 135,052 | 28.3% | 215,216 | 27.6% | |||
| White (Russian, Ukranian; Polish ancestry) | 94,147 | 14.6% | 45,014 | 13.7% | 68,702 | 14.4% | 111,334 | 14.3% | |||
| Black (African American) | 148,881 | 23.1% | 78,734 | 24.0% | 101,650 | 21.3% | 171,327 | 22.0% | |||
| Black (Afro Caribbean) | 32,602 | 5.0% | 14,738 | 4.5% | 18,094 | 3.8% | 35,837 | 4.6% | |||
| Hispanic (Puerto Rican) | 58,556 | 9.1% | 29,647 | 9.0% | 56,135 | 11.7% | 85,539 | 11.0% | |||
| Hispanic (Dominican) | 45,229 | 7.0% | 22,661 | 6.9% | 41,035 | 8.6% | 64,474 | 8.3% | |||
| Hispanic (other Latino immigrant groups) | 38,838 | 6.0% | 20,115 | 6.1% | 31,999 | 6.7% | 52,032 | 6.7% | |||
| Asian (Chinese) | 20,801 | 3.2% | 11,342 | 3.5% | 13,394 | 2.8% | 23,973 | 3.1% | |||
| Asian (South Asian) | 8,162 | 1.3% | 4,211 | 1.3% | 4,776 | 1.0% | 9,910 | 1.3% | |||
| Other Asian | 4,339 | 0.7% | 2,692 | 0.8% | 2,690 | 0.6% | 5,242 | 0.7% | |||
| Other | 99 | 0.0% | 51 | 0.0% | 113 | 0.0% | 7 | 0.0% | |||
| Total | 642,554 | 100.0% | 328,434 | 100.0% | 477,820 | 100.0% | 780,485 | 100.0% | |||
| Totals may be slightly different than Board of Election results due to the process of allocating Election District data to blocks and tracts. | |||||||||||
2013 vote share by candidate
Table 3 below shows where each candidate's vote came from. Among other things, it highlights that primary winner Bill de Blasio received more of his votes from white and African American communities — just over 71% — than the citywide vote average.
By comparison with earlier elections, Mark Green received 75% of his votes from predominantly white and African American areas in the 2001 primary. In 2009, William Thompson received 69% of his support from these areas.
| TABLE 3 | |||||||
| Race/ethnicity/ancestry categories based on CUR analysis of Census data |
De Blasio | Thompson | Quinn | Liu | Weiner | Other candidates |
Total |
| White (English, Scandinavian) | 0.9% | 0.5% | 1.6% | 0.4% | 0.5% | 0.4% | 0.8% |
| White (Italian, Irish, and Polish speakers) | 29.5% | 21.7% | 47.6% | 23.5% | 23.6% | 18.6% | 28.7% |
| White (Russian, Ukranian; Polish ancestry) | 13.5% | 14.5% | 21.2% | 10.5% | 12.2% | 13.1% | 14.6% |
| Black (African American) | 26.6% | 29.6% | 7.2% | 17.0% | 24.4% | 19.7% | 23.1% |
| Black (Afro Caribbean) | 6.2% | 6.5% | 1.1% | 2.5% | 5.4% | 4.4% | 5.0% |
| Hispanic (Puerto Rican) | 8.6% | 10.2% | 6.7% | 9.4% | 11.4% | 11.7% | 9.1% |
| Hispanic (Dominican) | 6.1% | 8.4% | 5.4% | 4.8% | 8.9% | 13.0% | 7.0% |
| Hispanic (other Latino immigrant groups) | 5.3% | 5.7% | 5.3% | 8.3% | 8.1% | 10.3% | 6.0% |
| Asian (Chinese) | 1.8% | 1.7% | 2.3% | 18.7% | 3.0% | 4.4% | 3.2% |
| Asian (South Asian) | 1.1% | 1.0% | 1.0% | 2.6% | 1.7% | 2.9% | 1.3% |
| Other Asian | 0.4% | 0.5% | 0.7% | 2.2% | 0.7% | 1.6% | 0.7% |
| Other | 0.0% | 0.0% | 0.0% | 0.0% | 0.0% | 0.0% | 0.0% |
| Total | 100.0% | 100.0% | 100.0% | 100.0% | 100.0% | 100.0% | 100.0% |
Figure 1 below illustrates the magnitude of votes for each primary candidate from each major ethnic voting bloc.
Unexpected shift in predominantly black communities
Quite remarkably, the leading white candidate in 2013 (de Blasio) received more support in predominantly black areas such as southeast Queens and central Brooklyn than did the well-known black candidate in the race (Thompson), who strongly carried those areas in his primary election four years earlier. (However, Thompson in 2009 and de Blasio in 2013 both received between 40 and 45% of their votes from predominantly white areas.)
Combining African American and Afro Caribbean communities, de Blasio clearly outpolled Thompson. But the predominantly African American communities cast many more votes than the Afro-Caribbean areas — just over 148,000 votes compared with less than 33,000. De Blasio received more votes than Thompson in the predominantly African American communities (almost 68,000 vs. just under 50,000).
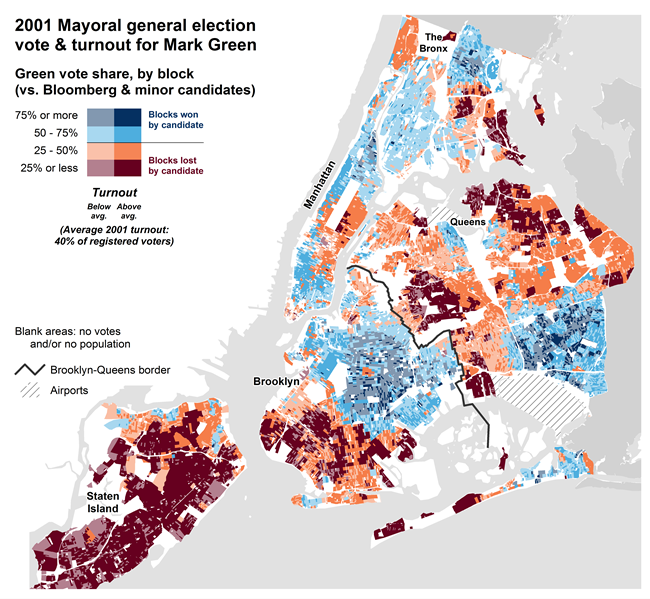
In 2001 — the most closely comparable primary election to 2013 — African American areas cast many more votes (roughly 171,000 in 2001 vs. just over 148,000 in 2013). In that year, voters in these areas split more evenly between the two front-runners — the white progressive Mark Green received almost 62,000 votes, but the minority candidate Fernando Ferrer received almost 78,000.
Looking to November
In recent primary elections, most primary voters (more than 75%) have also voted in the general election. But the general electorate is more varied, due to a substantial number of registered Democrats who did not vote in the primary (hundreds of thousands of voters in the each of the past several elections), voters from other parties (typically close to 150,000 Republicans and almost that many people who have not enrolled in a party), and some Democrats who voted in the primary but did not vote in the general election. A separate analysis from CUR examines the characteristics of these voters to provide a fuller picture of New York City's general electorate in anticipation of the upcoming mayoral vote on November 5.
Will there be a crossover Democratic vote in 2013?
Key communities to watch as the Nov. 5 mayoral election results come in.
In the most recent mayoral election, 300,000 registered Democrats voted against the Democratic mayoral nominee. These votes, combined with enough votes from Republicans, those registered in other parties, and those not registered in any party, resulted in a Democratic loss.
If the 2013 polls are correct, the Democratic crossover vote this year will be minimal. This would be a dramatic change from the last three local election cycles. To help political observers gauge the extent of this change, if it occurs, the following analysis highlights areas where large numbers of Democrats crossed over in the 2009 mayoral election to support the Republican incumbent. This year's Democratic nominee Bill de Blasio will win if he retains the support of his primary voters, persuades the primary voters who supported his to stick with him, and secures support from enough Democrats who have crossed over in the past. He does not have to win all Democrats, just persuade a substantial minority to not cross over to the other party.
On the other hand, if Republican nominee Joseph Lhota has persuaded a similar number of Democrats to cross over as in the past, it would be possible for him to win. The polls indicate this is unlikely, but not impossible. In 2009, Mayor Michael Bloomberg received 50.7% of the vote. Although New York City's electorate has certainly changed since Mayor Bloomberg was first elected (and even more since Rudolph Giuliani was elected in 1993), the city's population is pretty much the same as in 2009. Also, most currently registered voters (86%) were also enrolled in 2009. Therefore, we cannot absolutely rule out the possibility that the 2013 electorate will behave in similar ways if Lhota were to be able to show anything like the appeal of Mayors Bloomberg and Giuliani to these crossover Democrats.
Crossover Democrats key to 2009 Democratic loss
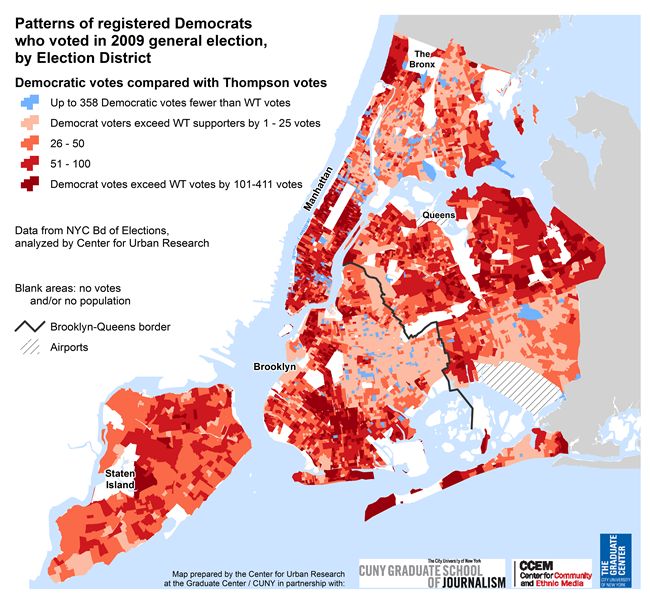
Usually, most Democrats voters in general elections support the Democratic candidate, but many did not in the last three mayoral elections. In 2009, for example, William Thompson received roughly 535,000 votes — almost 300,000 fewer than the number of Democrats who voted. These 300,000 Democrats therefore did not vote for the Democratic candidate (and perhaps a few more, if any non-Democrats voted for Thompson).
Map 1 below shows where these crossover Democrats voted. The pattern in Map 1 follows the areas closely that voted strongly for Mayor Bloomberg in his 2009 re-election — see Map 2 below. These include:
- south Brooklyn,
- the Queens neighborhoods of Middle Village and Howard Beach and much of northeastern Queens,
- Manhattan's upper east and west sides, and
- Riverdale and the eastern part of the Bronx.
These are white ethnic neighborhoods in the outer boroughs as well as more liberal white areas.
MAP 1
MAP 2
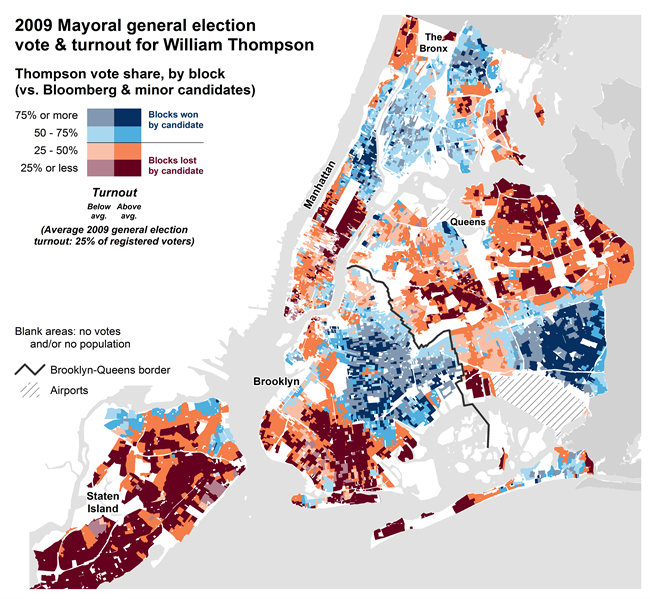
Thompson did not win all the Democratic votes even where he did well in the election (shown in blue in Map 2) — such as parts of Staten Island's north shore, areas in upper Manhattan, and sections of southeast Queens.
The reverse was true in a only a few areas. In the election districts shown in blue in Map 1, Thompson received more votes that the number of Democratic voters, so he drew support from voters enrolled in other parties. These EDs, however, are few and far between.
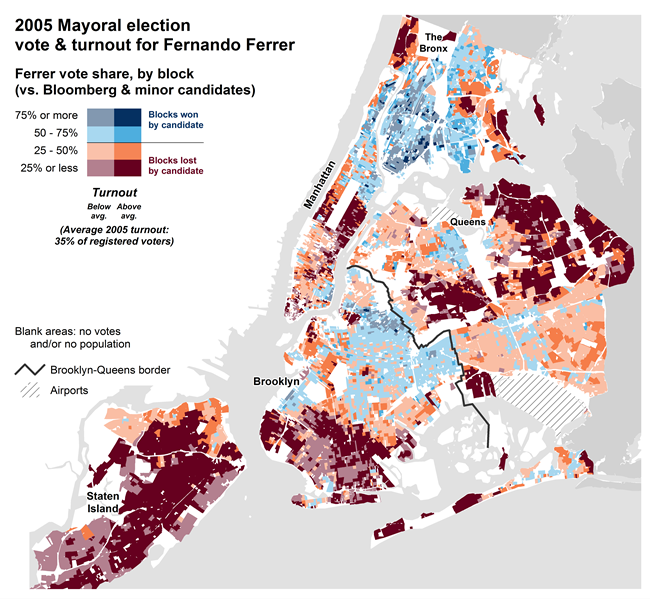
This 2009 general election pattern is not new — it has presented itself to some degree in each of the last three mayoral elections and even stretches back to the Koch elections of the 1980s. With a few exceptions, Bloomberg received strong support from the same areas in 2001 and 2005, highlighted in orange and red below in Maps 3 and 4.
MAP 3
MAP 4
"New" Democratic Voters in the General Election
Much of the crossover Democratic votes come from areas of the city where many Democrats did not vote in the primary. In the last three mayoral elections, the Democratic electorate has doubled from the primary. In other words, each November election has drawn as many "new" voters — those not voting in the primary — as those who already indicated their choices at the primary ballot box and also turned out for the general.
This increase has included roughly 150,000 Republicans, almost as many unaffiliated voters, and as many as 530,000 Democrats. Since 2001, between 400,000 and 530,000 registered Democrats voted in the general election but not the primary. According to Table 1, these voters increased as a share of Democratic voters between 2001 and 2009 even as the total number of voting Democrats decreased.
TABLE 1
| 2001 | 2005 | 2009 | ||||
| Total Democrats voting in either primary or general election | 979,333 | 100% | 917,521 | 100% | 821,717 | 100% |
| Democrats voting in general but not in primary | 413,079 | 42.2% | 531,541 | 57.9% | 515,830 | 62.8% |
| Democrats voting in both | 566,254 | 57.8% | 385,980 | 42.1% | 305,887 | 37.2% |
In 2009, these 515,000 non-primary Democrats represented the largest overall group of voters in the general election, categorized by major party. Table 2 below provides the breakdown:
TABLE 2
| 2009 general election | Voters | Share |
| Democrats voting in the general but not primary | 515,197 | 44.6% |
| Democrats voting in the primary & general | 305,606 | 26.5% |
| GOP | 145,039 | 12.6% |
| No party | 122,194 | 10.6% |
| Other | 66,766 | 5.8% |
| TOTAL | 1,154,802 | 100% |
Note also that 86,000 Democratic primary voters in 2009 did not participate in the general election. In other words, of the 330,000 primary voters that year [PDF], 26% decided to not vote in November.
This year the turnout pattern already is following the earlier elections. Turnout in this year's Democratic primary was relatively low. Almost 692,000 voters went to the polls [PDF], and only 282,000 of those voted for the Democratic nominee. Turnout will likely increase substantially on November 5, and the outcome of the election will hinge on the preferences of these new voters.